
 Yahoo Movies
 The 25 Best Cities To Buy a Home for Less Than $500K

The wild and red-hot housing market of 2021 sent the median home price soaring all the way to $312,728 at the start of December, according to Zillow. That means that if you have a half-million bucks to spend, you’re well above the homeowner in the middle of the pack.
See: 2021’s Competitive Housing Market: How Pricing, Inventory and More Changed Over the Year
Find Out: Here’s Where Home Prices Are Headed in 2022, According To Experts
If your budget tops out at $500,000 then you’ve got plenty of options on where to put down roots. But that sum buys far more in some places than it does in others and buying just the right home in just the right place is about a lot more than just the average price per square foot.
Using data from Zillow, the U.S. Census Bureau, the Bureau of Labor Statistics and Sterling’s Best Places, GOBankingRates identified the 25 best cities to buy a home on that budget. To paint a complete picture of what it really means to buy a $500,000 home in different places across the country, the study examines not just factors like average home cost and median income, but also crime, poverty and unemployment. It also sheds light on each city’s cost of living by looking at the cost of necessities like utilities, healthcare, transportation and groceries.
With those factors and others in mind, here’s a look at the 25 best places to buy a home for less than $500,000.
Ogden, Utah
Combined score: 55490
2021 average home cost: $427,985
Livability: 73
Median household income: $2,161,599
Area unemployment rate:5%
% of people below poverty line:6
Violent crime rate (per 1,000 residents): 37
Property crime rate (per 1,000 residents):78
Annual grocery cost: $4,561.47
Annual health care cost: $5,301.25
Annual utilities cost: $3,979.21
Annual transportation cost: $4,378.89
Total annual necessities minus housing: $13,841.92
Fort Wayne, Indiana
Combined score: 86316
2021 average home cost: $178,708
Livability: 80
Median household income: $155,622
Area unemployment rate: 4%
% of people below poverty line:2
Violent crime rate (per 1,000 residents): 62
Property crime rate (per 1,000 residents): 56
Annual grocery cost: $4,516.99
Annual health care cost: $4,126.07
Annual utilities cost: $3,771.31
Annual transportation cost: $4,106.79
Total annual necessities minus housing: $12,414.36
Learn: Avoid These Home Renovation Horror Stories
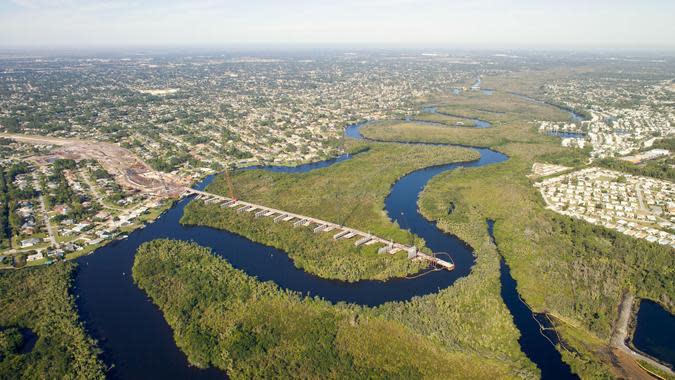
Port St. Lucie, Florida
Combined score: 05868
2021 average home cost: $292,029
Livability: 81
Median household income: $215,888
Area unemployment rate:2%
% of people below poverty line:9
Violent crime rate (per 1,000 residents): 45
Property crime rate (per 1,000 residents):4
Annual grocery cost: $5,174.27
Annual health care cost: $5,316.78
Annual utilities cost: $3,904.36
Annual transportation cost: $5,175.05
Total annual necessities minus housing: $14,395.42
Raleigh, North Carolina
Combined score: 10723
2021 average home cost: $341,487
Livability: 78
Median household income: $70,655
Area unemployment rate:1%
% of people below poverty line:9
Violent crime rate (per 1,000 residents):6
Property crime rate (per 1,000 residents): 34
Annual grocery cost: $4,971.65
Annual health care cost: $4,824.96
Annual utilities cost: $4,120.58
Annual transportation cost: $4,464.55
Total annual necessities minus housing: $13,917.19
Madison, Wisconsin
Combined score: 17881
2021 average home cost: $324,491
Livability: 75
Median household income: $244,859
Area unemployment rate:6%
% of people below poverty line:9
Violent crime rate (per 1,000 residents): 62
Property crime rate (per 1,000 residents): 93
Annual grocery cost: $4,838.22
Annual health care cost: $4,467.75
Annual utilities cost: $4,469.85
Annual transportation cost: $4,323.46
Total annual necessities minus housing: $13,775.82
Tips: 17 Dumb Home-Buying Mistakes That Hurt Your Wallet
North Port, Florida
Combined score: 25176
2021 average home cost: $340,328
Livability: 71
Median household income: $407,640
Area unemployment rate:7%
% of people below poverty line: 2
Violent crime rate (per 1,000 residents):37
Property crime rate (per 1,000 residents): 76
Annual grocery cost: $5,144.62
Annual health care cost: $5,052.75
Annual utilities cost: $4,041.58
Annual transportation cost: $4,887.83
Total annual necessities minus housing: $14,238.95
Virginia Beach, Virginia
Combined score: 37708
2021 average home cost: $280,545
Livability: 79
Median household income: $100,757
Area unemployment rate:8%
% of people below poverty line: 6
Violent crime rate (per 1,000 residents): 32
Property crime rate (per 1,000 residents): 57
Annual grocery cost: $4,956.83
Annual health care cost: $5,632.58
Annual utilities cost: $4,037.42
Annual transportation cost: $4,938.22
Total annual necessities minus housing: $14,626.82
Columbus, Ohio
Combined score: 49226
2021 average home cost: $252,101
Livability: 77
Median household income: $677,095
Area unemployment rate:3%
% of people below poverty line:5
Violent crime rate (per 1,000 residents):09
Property crime rate (per 1,000 residents): 78
Annual grocery cost: $4,882.70
Annual health care cost: $4,483.28
Annual utilities cost: $4,245.32
Annual transportation cost: $4,540.14
Total annual necessities minus housing: $13,611.30

Charleston, South Carolina
Combined score: 54022
2021 average home cost: $323,093
Livability: 74
Median household income: $303,669
Area unemployment rate:9%
% of people below poverty line: 7
Violent crime rate (per 1,000 residents): 79
Property crime rate (per 1,000 residents): 21
Annual grocery cost: $5,218.75
Annual health care cost: $5,078.64
Annual utilities cost: $4,224.53
Annual transportation cost: $4,741.70
Total annual necessities minus housing: $14,521.92
Learn More: 20 Insider Tips To Save Money on Every Part of Your Home
Grand Rapids, Michigan
Combined score: 54714
2021 average home cost: $260,344
Livability: 67
Median household income: $111,430
Area unemployment rate:6%
% of people below poverty line: 5
Violent crime rate (per 1,000 residents):43
Property crime rate (per 1,000 residents): 45
Annual grocery cost: $4,704.78
Annual health care cost: $4,317.62
Annual utilities cost: $4,153.84
Annual transportation cost: $4,792.09
Total annual necessities minus housing: $13,176.24
Portland, Maine
Combined score: 55318
2021 average home cost: $396,649
Livability: 70
Median household income: $372,170
Area unemployment rate:5%
% of people below poverty line:7
Violent crime rate (per 1,000 residents): 43
Property crime rate (per 1,000 residents): 9
Annual grocery cost: $5,500.45
Annual health care cost: $4,907.80
Annual utilities cost: $4,270.27
Annual transportation cost: $3,849.80
Total annual necessities minus housing: $14,678.51
El Paso, Texas
Combined score: 58272
2021 average home cost: $160,347
Livability: 78
Median household income: $301,148
Area unemployment rate:4%
% of people below poverty line: 7
Violent crime rate (per 1,000 residents):6
Property crime rate (per 1,000 residents): 7
Annual grocery cost: $4,546.64
Annual health care cost: $4,488.46
Annual utilities cost: $4,037.42
Annual transportation cost: $4,630.84
Total annual necessities minus housing: $13,072.52
Lafayette, Louisiana
Combined score: 59975
2021 average home cost: $172,501
Livability: 72
Median household income: $1,975,126
Area unemployment rate:2%
% of people below poverty line: 4
Violent crime rate (per 1,000 residents):37
Property crime rate (per 1,000 residents): 1
Annual grocery cost: $4,734.44
Annual health care cost: $4,840.50
Annual utilities cost: $3,646.57
Annual transportation cost: $5,114.59
Total annual necessities minus housing: $13,221.50
Don’t Break the Bank: 30 Ways To Upgrade Your Home Without Blowing Your Budget
Killeen, Texas
Combined score: 61255
2021 average home cost: $193,112
Livability: 77
Median household income: $366,598
Area unemployment rate:1%
% of people below poverty line: 7
Violent crime rate (per 1,000 residents):84
Property crime rate (per 1,000 residents): 64
Annual grocery cost: $4,507.10
Annual health care cost: $5,052.75
Annual utilities cost: $4,174.63
Annual transportation cost: $3,990.89
Total annual necessities minus housing: $13,734.49
Omaha, Nebraska
Combined score: 61303
2021 average home cost: $233,635
Livability: 76
Median household income: $1,120,319
Area unemployment rate:7%
% of people below poverty line:1
Violent crime rate (per 1,000 residents):03
Property crime rate (per 1,000 residents): 87
Annual grocery cost: $4,773.97
Annual health care cost: $6,745.63
Annual utilities cost: $4,099.79
Annual transportation cost: $4,116.86
Total annual necessities minus housing: $15,619.39
Fayetteville, Arkansas
Combined score: 64438
2021 average home cost: $240,894
Livability: 72
Median household income: $210,344
Area unemployment rate:2%
% of people below poverty line:6
Violent crime rate (per 1,000 residents): 57
Property crime rate (per 1,000 residents): 14
Annual grocery cost: $4,942.00
Annual health care cost: $4,550.58
Annual utilities cost: $3,850.31
Annual transportation cost: $4,363.77
Total annual necessities minus housing: $13,342.89

Tampa, Florida
Combined score: 64830
2021 average home cost: $283,871
Livability: 75
Median household income: $95,139
Area unemployment rate:9%
% of people below poverty line: 4
Violent crime rate (per 1,000 residents): 18
Property crime rate (per 1,000 residents):4
Annual grocery cost: $5,194.04
Annual health care cost: $5,099.35
Annual utilities cost: $4,004.15
Annual transportation cost: $5,648.72
Total annual necessities minus housing: $14,297.54
Lexington, Kentucky
Combined score: 65240
2021 average home cost: $225,348
Livability: 64
Median household income: $441,896
Area unemployment rate:3%
% of people below poverty line: 3
Violent crime rate (per 1,000 residents):08
Property crime rate (per 1,000 residents): 08
Annual grocery cost: $4,843.16
Annual health care cost: $4,648.95
Annual utilities cost: $3,779.62
Annual transportation cost: $4,409.13
Total annual necessities minus housing: $13,271.73
Helpful: 8 Insider Tips To Get Rich in Real Estate
Melbourne, Florida
Combined score: 71169
2021 average home cost: $272,818
Livability: 75
Median household income: $101,776
Area unemployment rate:8%
% of people below poverty line:7
Violent crime rate (per 1,000 residents): 7
Property crime rate (per 1,000 residents): 87
Annual grocery cost: $4,946.94
Annual health care cost: $4,887.09
Annual utilities cost: $4,045.73
Annual transportation cost: $4,202.53
Total annual necessities minus housing: $13,879.76
Richmond, Virginia
Combined score: 73742
2021 average home cost: $284,786
Livability: 72
Median household income: $361,576
Area unemployment rate:6%
% of people below poverty line: 10
Violent crime rate (per 1,000 residents):73
Property crime rate (per 1,000 residents): 3
Annual grocery cost: $4,843.16
Annual health care cost: $5,078.64
Annual utilities cost: $4,112.26
Annual transportation cost: $4,207.57
Total annual necessities minus housing: $14,034.06
Minneapolis
Combined score: 78275
2021 average home cost: $334,116
Livability: 65
Median household income: $777,096
Area unemployment rate: 3%
% of people below poverty line: 2
Violent crime rate (per 1,000 residents):56
Property crime rate (per 1,000 residents): 52
Annual grocery cost: $5,001.30
Annual health care cost: $4,063.95
Annual utilities cost: $4,145.53
Annual transportation cost: $5,467.32
Total annual necessities minus housing: $13,210.78
Lakeland, Florida
Combined score: 78728
2021 average home cost: $233,992
Livability: 81
Median household income: $78,584
Area unemployment rate: 5
% of people below poverty line: 14
Violent crime rate (per 1,000 residents):52
Property crime rate (per 1,000 residents): 85
Annual grocery cost: $5,075.43
Annual health care cost: $4,990.63
Annual utilities cost: $4,074.84
Annual transportation cost: $4,262.99
Total annual necessities minus housing: $14,140.90
Pittsburgh
Combined score: 79406
2021 average home cost: $191,572
Livability: 73
Median household income: $428,777
Area unemployment rate:4
% of people below poverty line: 9
Violent crime rate (per 1,000 residents):91
Property crime rate (per 1,000 residents): 23
Annual grocery cost: $4,991.42
Annual health care cost: $4,436.69
Annual utilities cost: $4,253.63
Annual transportation cost: $5,316.15
Total annual necessities minus housing: $13,681.74
Find: 26 Home Makeover Ideas That Each Cost Less Than $500

Des Moines, Iowa
Combined score: 81971
2021 average home cost: $228,518
Livability: 77
Median household income: $124,580
Area unemployment rate:9%
% of people below poverty line:7
Violent crime rate (per 1,000 residents): 26
Property crime rate (per 1,000 residents):7
Annual grocery cost: $4,744.32
Annual health care cost: $5,943.20
Annual utilities cost: $3,725.57
Annual transportation cost: $3,764.13
Total annual necessities minus housing: $14,413.08
San Antonio, Texas
Combined score: 82391
2021 average home cost: $244,582
Livability: 76
Median household income: $617,205
Area unemployment rate:5
% of people below poverty line: 5
Violent crime rate (per 1,000 residents):15
Property crime rate (per 1,000 residents): 77
Annual grocery cost: $4,516.99
Annual health care cost: $4,830.14
Annual utilities cost: $3,945.94
Annual transportation cost: $5,003.73
Total annual necessities minus housing: $13,293.07
More From GOBankingRates
Social Security Schedule: When the First COLA Checks Will Arrive in January 2022
5 Easy Things You Can Do To Start Preparing For Retirement Now
Methodology: In order to find the best cities to buy a home for under $500,000, GOBankingRates looked at the 101 most populous cities where home values in 2021 did not go above $50,000 and had a 2021 average below $500,000 according to Zillow’s 2021 data. Once these 101 cities were identified, GOBankingRates looked at the following factors: (1) median household income as sourced from the United States Census Bureau’s 2019 American Community Survey; (2) an overall livability score out of 100 sourced from AreaVibes; (3) violent crime rate per 1,000 residents and (4) property crime rate per 1,000 residents, both sourced from Neighborhood Scout; (5) Metropolitan Statistical Area unemployment rate from the Bureau of Labor Statistics’ preliminary data for September 2021; (6) percent of population living below the poverty line sourced from the United States Census Bureau’s 2019 American Community Survey; and (7) an annual cost of living expenditures estimate (groceries, healthcare, utilities, and transportation), based on the Bureau of Labor Statistics’ 2020 Consumer Expenditure Survey and local cost of living indices sourced from Sperling’s Best Places. All factors were then scored and combined, with the lower score being best, and then ranked to give the final placements. All data was collected on and up to date as of Nov. 22, 2021.
This article originally appeared on GOBankingRates.com: The 25 Best Cities To Buy a Home for Less Than $500K

